How Financial Analysis Can Improve Company Performance
Financial analysis can constitute a multitude of techniques and tools used to identify, gauge and act upon various trends, patterns, and insights of the business’s performance for a given period. This may include ratio analysis to understand the business’s profitability and financial stability, cash-flow forecasting and management accounts to facilitate planning or more in-depth analytics such as regression to identify correlation between 2 variables, whether seasonality is playing a role in demand and if so, then how the business can time its inventory purchases to optimize cash-flow management.
In this article, we’ll cover certain tools and techniques which you can utilize to improve business performance as well as the benefits and limitations of these tools.
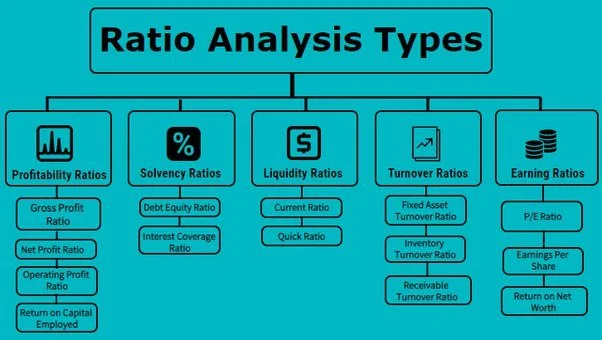
1] Ratio Analysis: These are formulas which link 2 (or more) sets of figures from the financial statements of an organization. They’re often used as an indicator for how the business has performed in the past period but may also flag areas of concern which deserve management attention. This involves comparisons of actual performance against targets, understanding the trend in a particular ratio over time, termed as horizontal analysis, or benchmarking the firm’s own performance with that of its competitors to identify aspects of the firm’s performance or financial position which can be ameliorated. Common ratios which stakeholders are interested in include gross profit margin, current and acid-test ratio, interest cover and gearing, earnings per share and return on capital employed amongst others.
We can compute and provide insights on a range of ratios
However, ratio analysis isn’t without its constraints. Firstly, it only shows past performance rather than enabling a business to forecast for the future. Additionally, it emphasizes only the financial aspects of a firm’s performance rather than considering non-financial aspects which may impact the firm including innovation, staff morale and retention, quality etc. Finally, ratios are only meant to show the ‘what’ rather than the ‘why’. Simply looking at the ratio and comparing it with previous years or competitors won’t provide many insights. Instead, the components of the ratio must be identified, and perhaps further investigation could be needed to understand the movement in the ratio from one point in time to another
2] Forecasting and management accounts: Planning is a crucial element for most businesses with budgets being the most commonly used means of estimating prospective performance. Through variance analysis, managers can identify deviations from target and act in advance. This may include noticing insufficient cash in future months and arranging financing well in advance to plug the liquidity gap. This avoids facing extortionate interest rates if last-minute financing is sought which would cripple the business’s profitability but also worsen its operating leverage and push it to the brink of insolvency given that interest payments represent fixed costs which must be paid regardless of organizational performance. Similarly, firms seeking to raise finance either via loans from banks or venture capitalists are also likely to be required to present forecasts of how they plan to use the funds. Scenario analysis is another way of forecasting different outcomes based on certain events occurring. This is usually used to ascertain the position of the business in optimistic, baseline and pessimistic scenarios.
Nevertheless, they are ultimately forecasts implying that their usefulness depends upon the accuracy of data which has been input into the forecasting software as well as the extent to which the actual environment corresponds to forecast environment. Given the dynamic business environment presented by the confluence of Covid-19, spiralling inflation and rising energy prices, it isn’t surprising that many companies would’ve had their budgets become obsolete in the past 2 years as few would’ve been able to predict the emergence of these factors.
3] Regression analysis: This requires knowledge of business analytics and is more advanced than the previous tools. Contrary to what some may believe, regression often doesn’t indicate anything related to causation. Instead, it’s more about co-relation. Simple regression involves an independent variable and a dependent variable, whereby changes in the value of the former are observed to understand the effect on the latter. Examples include marketing spend (independent variable) and sales revenue (dependent variable). If sales and marketing spend are positive correlated, one would expect higher marketing expenditure to yield higher sales. Regression analysis can also display how much of the change in the value of sales is arising from the marketing spend, by observing what’s known as the co-efficient of determination. This can enable firms to understand the effectiveness of their marketing spend.
However, regression analysis is often conducted on a sample of data implying that the results have to taken with a pinch of salt since they’re not completely representative of the underlying population. Similarly, the data collection must be inspected to ensure minimal scope for errors.
Do you wish to undertake such analysis for your business as well? Are you seeking to explore its potential? Then Cheylesmore Accountants are the partners you need to supercharge your business’s performance! In addition to carrying out financial analysis, we can also offer a host of tax planning, bookkeeping and payroll-related services to enable you to be at ease about your business’s financial affairs.

